


Multi-Function USB Tester Type-C Micro USB Digital Voltmeter QC 2.0 QC 3.0 QC4.0 PPS PD E-mark Digital Voltage Current Power Bank Tester with the gravity sensor.
XB001C USB Type-C Multimeter
This product is a USB Type-C meter with various functions.
Warning
The seller is not responsible for any consequences produced by mistaken operations.
Main features
- Read the voltage & current
- Fast-charge trigger
- Fast-charge auto detection
- Current & voltage graphing
- E-mark reader
- Oscilloscope
- Statistics
Current & voltage graphing

Double-click the middle button on the home panel to enter the current & voltage graphing panel, and you can see the graph of current and voltage on VBUS with time.
The readings in the four corners of the screen display the highest and lowest values in the chart respectively.
The real-time value of the current and voltage is displayed in the middle of the upper part of the screen; the time interval of each grid is displayed in the lower part.
Pause
The icon on the upper right side of the panel shows the current status (Paused or not),  means it is continuously graphing, and
  means the graphing is paused. To pause/continue the graphing, click the middle button.

Sampling rate adjustment
Press the left or right key to adjust the sampling rate, to the left is to decrease, and to the right is to increase. After adjustment, the sampling rate will be briefly displayed on the screen. The maximum sampling rate on this panel is 40 times per second.
Exit graphing
Double-click the middle key to exit graphing.
E-mark reader
The meter is capable of reading the E-mark information of Type-C cables. To use this feature, power the meter on with the host port, and do not leave anything plugged in on Type-C IN/OUT ports. Afterwards, you plug in one side of the cable to the OUT port (Female port) of the meter and leave the other side floating (As shown below). Finally, press and hold the right button on the home panel to enter the E-mark reader panel. The meter will communicate with the cable and show cable information.

Fast charge automatic enumeration
Connect the meter to the charger, press and hold the left button on the meter's home panel. The meter will ask whether to perform a fast charge enumeration. Before the enumeration, make sure no load devices (e.g., Smartphones, tablets) remain on the meter.
Warning
During fast charge enumeration, load devices (e.g., Smartphones, tablets) can be burnt if they are connected to the meter.
Select "Yes" on the confirmation panel to enter the fast charge automatic enumeration panel, and the meter will automatically detect the available fast-charge protocols. After the detection completes, the upper right corner will prompt "Complete", supported protocols are displayed in green, and the unavailable protocols are displayed in red.

Double-click the middle key to exit this panel.
Fast-charge trigger
Power Delivery
The Power Delivery protocol (And its subsets, e.g., PPS) must be triggered at power-up time.
Connection
The meter can be connected to the charging port in two ways: direct connection and connection through cable. The sketches of the two methods are as follows:
Direct connection

If the meter is directly connected to the charging port, you can press any of the left and right keys to power the meter on.
Connect through a cable

If the meter is connected to the charging head through a cable, only one of the left and right keys can power on the meter. Press the button on any side and hold it for 3 seconds. If the screen does not light up, press it on the other side to power the meter on.
Power-on options
After power-on, you have three options; we explain them to you one by one as follows:
-
 Keep Power Only The meter won't respond to PD messages; it only pulls down the CC line. With this option, you cannot trigger PD fast charge, but you can start triggering other protocols.
 -
 Start PD Trigger Pull down the CC line, respond to the PD message, and enter the PD trigger panel. If you want to trigger PD, you need to select this option within a certain period after power-on; otherwise, the communication could time out.
-
 Power Off Release the pull-down on the CC line. This option will stop the charging port from supplying power; thus, the meter will be shut down.
PD trigger panel
After entering the PD trigger panel, the meter displays the current and voltage supported by the charging port. Like the following example:

The items with "Fix" represent fixed voltage PDOs, and the items with a voltage range represent PPS PDOs with adjustable voltages. Scroll to the left or right to select an item, and then press the middle button to trigger this PDO.
For a fixed voltage PDO, after the voltage is triggered, there will be a tick  on its right side indicating the trigger is successful.
For a PPS PDO, click the middle button to enter the PPS trigger panel. On this panel, the upper two readings show the real-time voltage and current, and the lower-left represents the target voltage set by the current protocol communication. The lower-right represents a single adjustment interval. Scroll the key to the left or right to adjust the voltage. Double-click the middle button to return to the previous panel.
Other protocols
On the home panel, click the left button to enter the fast-charge trigger panel. Select the protocol you want to trigger on the trigger panel, and then press the middle button to enter.

For example, if you want to trigger the QC2.0 protocol, select the QC2.0 protocol, click the confirm button, wait for the completion of the communication, and the meter will enter the trigger panel of the corresponding protocol. The specific panel of each protocol are shown in the figure below.
Main menu
Long press the middle button in any home panels to enter the main menu panel. There are multiple submenus in the menu. Scroll the key to the left and right to select a submenu item or adjust parameters, click the middle button to enter or save, and double click the middle button to exit.

 Display

 Brightness
Select this to adjust the screen brightness. Click the middle button to save the change.

 Idle Time
If there is no operation to the meter in a period of time, it will enter the idle mode and dim the screen. You can change the idle waiting time before the screen goes dark with this option. Rotation
Change the orientation of the screen. Choose "Auto" to make the meter change the orientation automatically with the gravity sensor.
 Refresh and +1 Taring
For details, see meter settings。
 Data Groups
Make change to data groups,see Statistics for details。
 Misc Features

Apple Adapter Info
Plug-in in to an Apple PD charger, and enter this option. You should be able to see the following:

 Language
Set the language.
 Debug
Debug
Show the debug menu of the meter
 Information
Show device information.
Voltage & current measurement
Overview Panel
This meter can measure voltage and current. The main panel of the measurement is as follows:

There are 3 readings shown in big fonts, U shows the voltage,I shows the current,and Pshows the power. There are instantaneous bar graphs below the readings to catch faster movements.
Click the middle button to switch to other measurement panels.
Detailed measurement manual
There are more detailed data displayed in this panel:

-
The voltage and the current on the VBUS.
-
 The voltage on the USB D+.
 -
 The voltage on the USB D-.
 -
 The power on the VBUS.
 -
 The self current consumption of the meter.
 -
 The fast-charge protocol that has been negotiated between the charger and the load device.
 -
The voltage and the current that has been negotiated between the charger and the load device.
Measurement related settings
Taring
"Taring" is a patented feature of this meter, which allows the meter to accurately display the input or output current (the difference between the two is the meter's own power consumption).
Traditional Type-C meters cannot eliminate the impact of their own power consumption on the measurement. These meters will read out as 0mA when powered from one side, and read out their own power consumption when powered from the other side. The user cannot clearly determine whether the current is input current or output current.
Long-press the middle key on home panels to enter the main menu, select "Display", and then look down to the "Taring" option. In the "Taring" option, you can choose among "Tare to meet output", "Tare to meet input" and "Show raw readings". When "Tare to meet output" or "Tare to meet input" is set, the meter can display accurate current regardless of the actual power direction.
When the host power supply (PC port) is present, the meter itself stops taking power from the circuit to be tested and instead takes power from the host power supply port. This option has no meaning since the input and output currents are the same.
Refresh Rate
Long-press the middle key on home panels to enter the main menu, select "Display", and then look down to the "Refresh" option. In the "Taring" option, you can choose among "Tare to meet output", "Tare to meet input" and "Show raw readings". When "Tare to meet output" or "Tare to meet input" is set, the meter can display accurate current regardless of the actual power direction.
This option sets the refresh rate of the meter's readings. There is a specific update rate for each choice. For example, 5sps means readings update 5 times per second.
Oscilloscope panel
You can click the right button to enter the oscilloscope panel.

In the oscilloscope panel, you can see the ripple voltage on VBUS.
Values on the left side of the panel display the highest and lowest voltages in the graph respectively(“+50mV” and “-50mV” in this example).
The upper middle of the panel displays the peak-to-peak value of the voltage (64mVpp in this example) and the primary component frequency (888kHz in this example); the lower part displays the real-time DC current and voltage on the VBUS. The time interval of each grid is displayed in the lower right corner.
Pause
The icon on the upper right side of the panel shows the current status (Paused or not), means it is continuously graphing, and means the graphing is paused. To pause/continue the graphing, click the middle button.
Sampling rate adjustment
Press the left or right key to adjust the sampling rate, to the left is to decrease, and to the right is to increase. After adjustment, the sampling rate will be briefly displayed on the screen. The maximum sampling rate on this panel is 8Ms/s.
Exit graphing
Double-click the middle key to exit graphing.
Statistics panel
On statistics panel, you can read out the statistics as follows:

-
Real-time voltage and current
-
 Accumulated capacity
 -
 Accumulated energy
 -
 Total time of accumulation
 -
 Current data group No.
 -
 Platform voltage
 -
 Current temperature
Statistics related settings

Clear group
Long-press the middle key on home panels to enter the main menu, select "Data Group". Select "Clear This Group" to clear present group. Select "Clear All Groups" to clear all data groups.
Switch group
Long-press the middle key on home panels to enter the main menu, select "Switch Group", then choose the group you want to switch into.
Accumulation threshold
Long-press the middle key on home panels to enter the main menu and select "Threshold" to set the accumulation threshold. The accumulation keeps running when the current is greater than the threshold and stops when the current is smaller than the threshold. A threshold of 0mA means the meter keeps accumulating no matter how small the current is.
Helpers Lab USB Multimeter
PC Software UI Manual
V1.00.44
0.1 Version & Update
Due to the complexity of the features, software/firmware/hardware can vary frequently, this manual might not be applicable for the latest software/firmware/hardware release.
0.2 Revision History
V1.00.44 20200815
- Added manual for the load module.
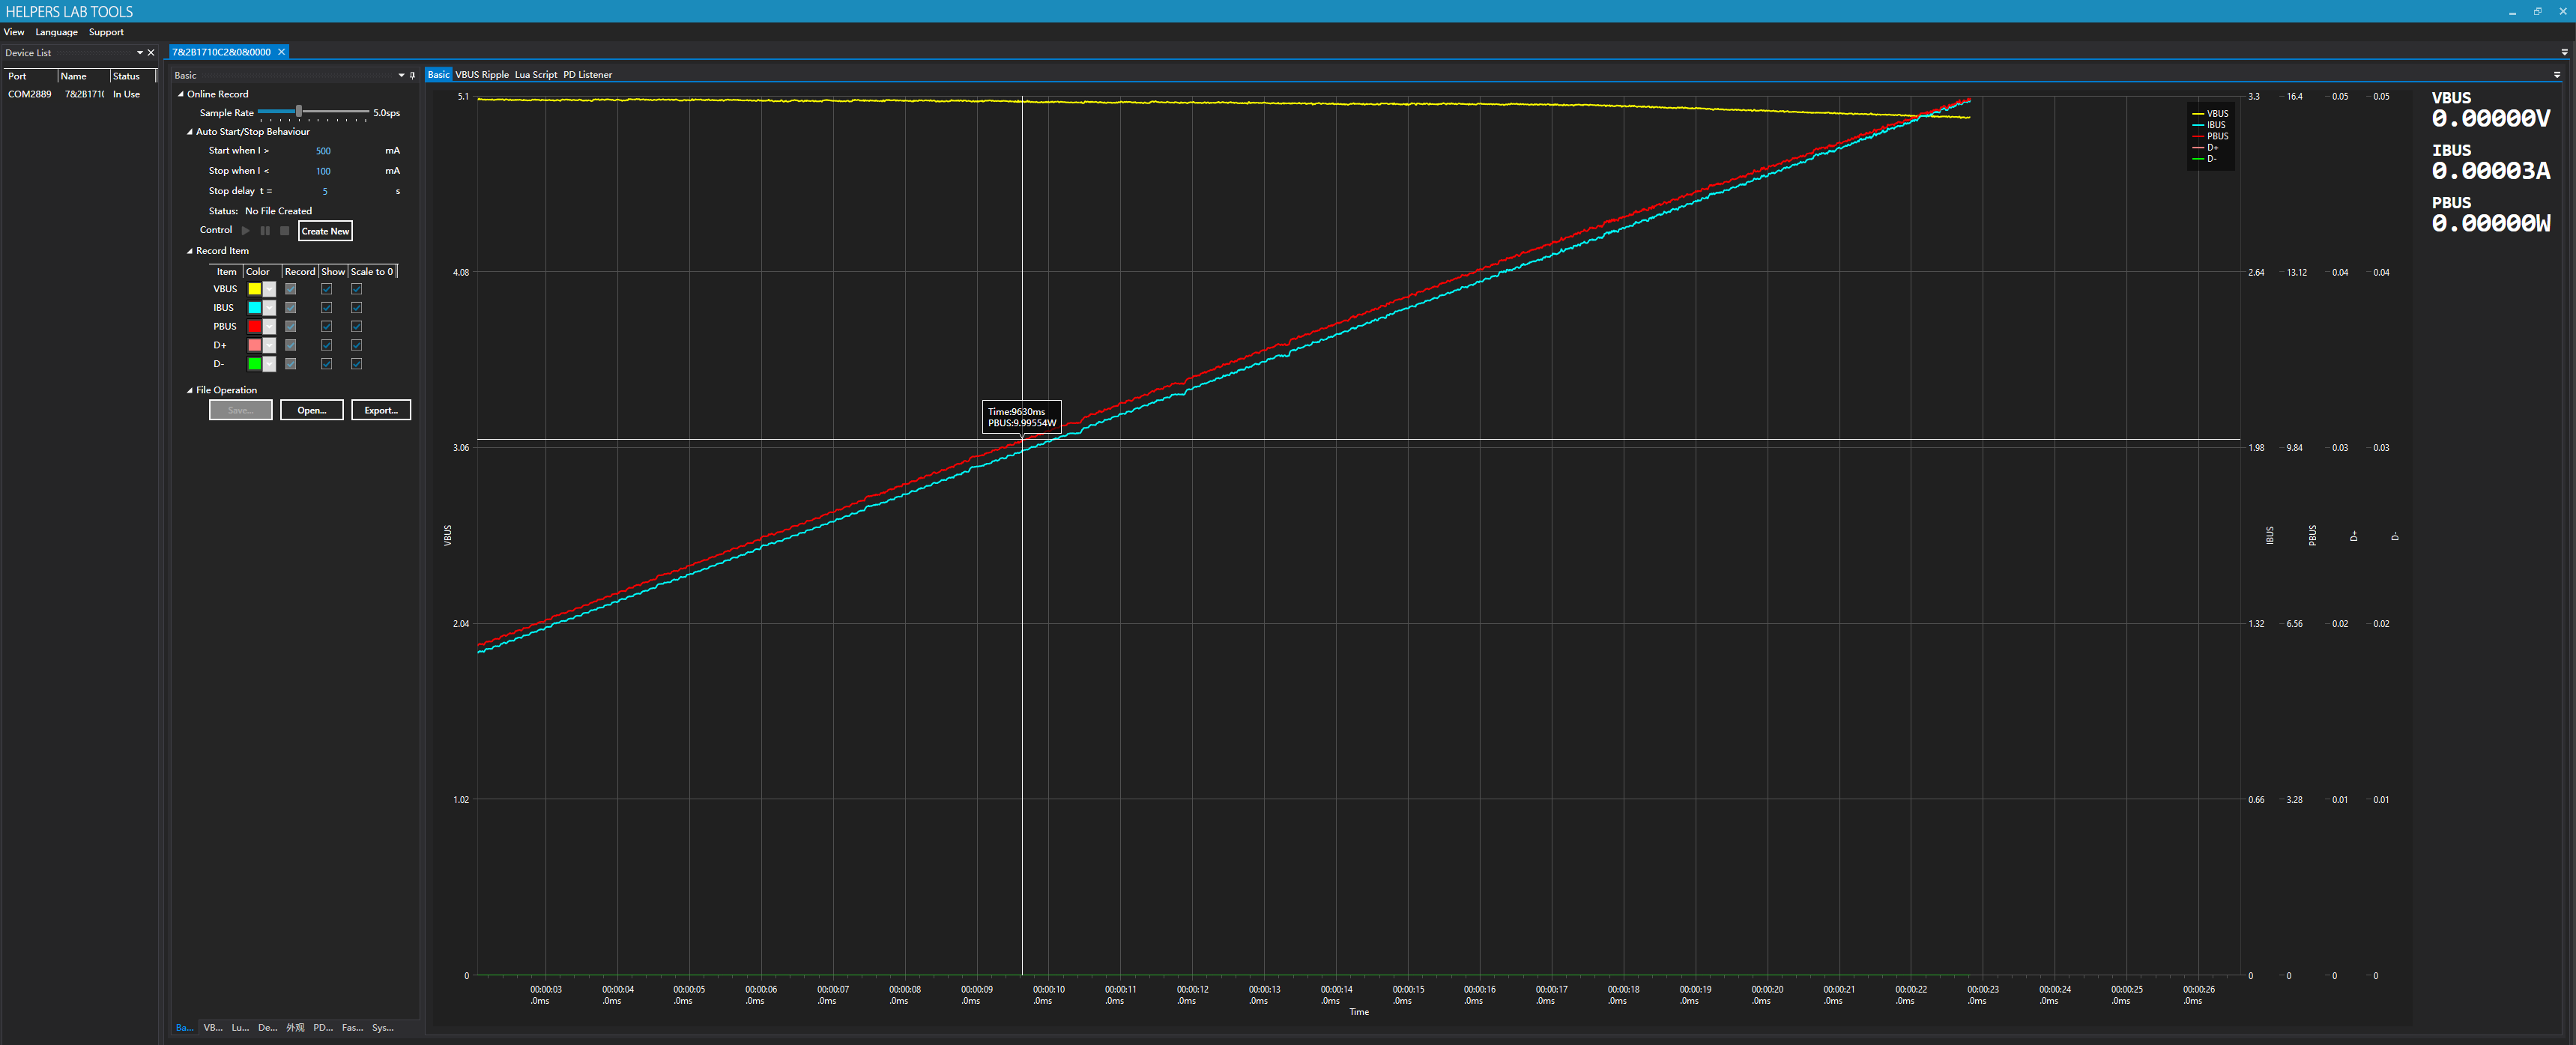
1.0 Connect the meter
Connect the meter and PC with a micro USB cable.
Open PC software, you should be able to see something like the following:
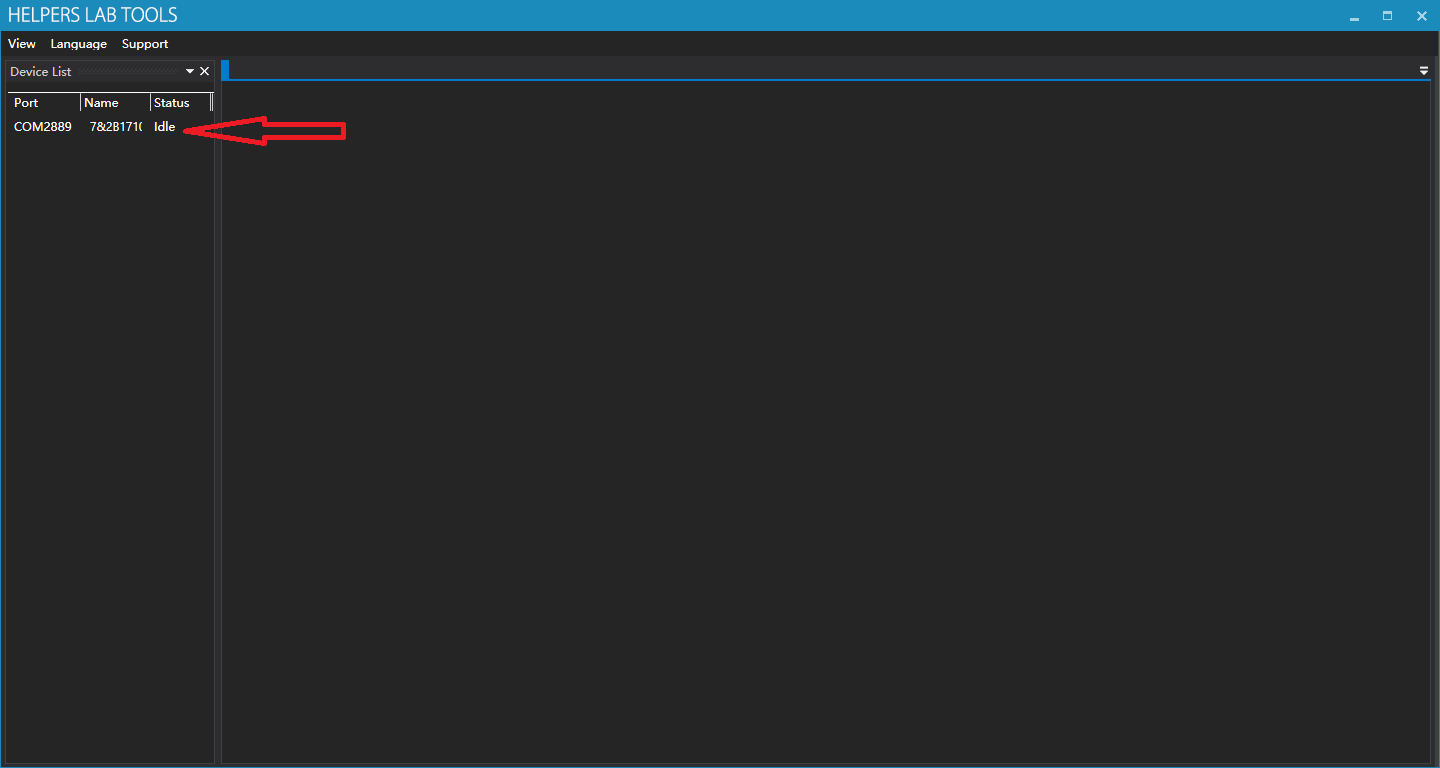
The red arrow points to the device we’ve just connected.
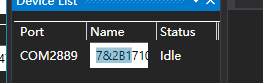
You can click the name of the meter to rename it, it’s used to differentiate them when multiple meters are connected.
Double-click the device, the following should be shown:
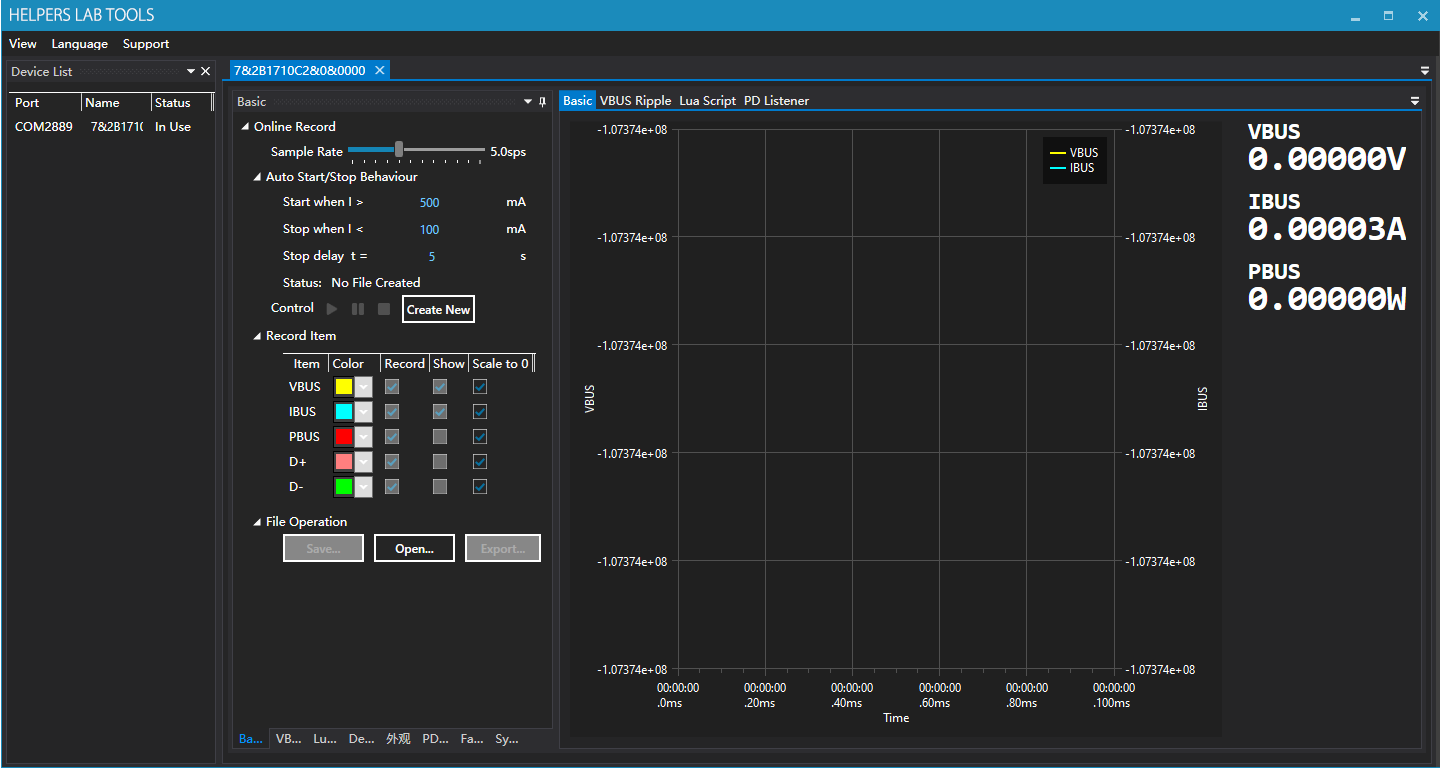
Now we will introduce the features one by one:
2.0 Basic(Data Logging)
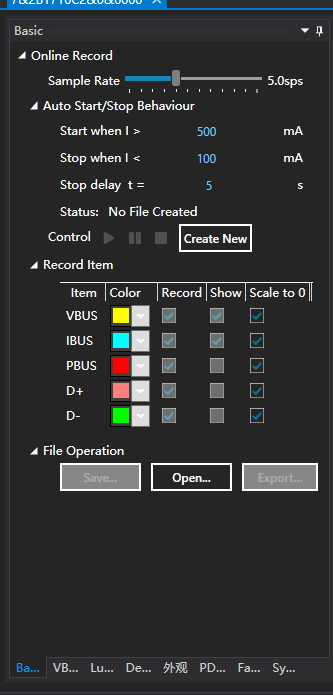
2.0.0 Create New
Click “Create New” to create a new record.
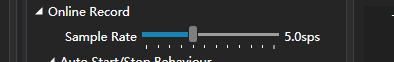
2.0.1 Sample Rate
Drag to adjust the sample rate of the record, range 0.2-1000sps.
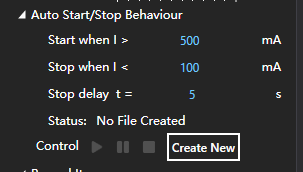
2.0.2 Auto Start/Stop Behavior
After clicking the start button, the record will not start immediately. The program waits for the current to go above Start Current, then it starts record. If you want the record to start immediately, you should set Start Current to 0.
You can specify a current, below which the record stops automatically. If this value is specified as 0, the record will never stop automatically.
To prevent instantaneous low current triggered stop condition unexpectedly, you can set “Stop Delay” parameter, only the current is below the stop threshold for a certain amount of time(Stop Delay t), the record will be stopped.
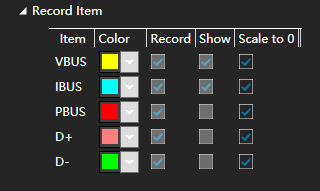
2.0.3 Record Items
To change the color of a record item, click the color combo box.
Check/Uncheck “Record” column to specify items to be recorded.
Check/Uncheck “Show” column to specify items to be graphed.
Check/Uncheck “Scale to 0” column to specify if a item is graphed relative to 0 (That is, force the lower bound of the graph to be 0).
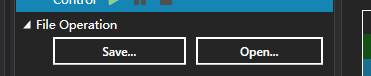
2.0.4 File Operation
Click “Save…” to save the current opened record as file (The record should be stopped).
Click “Open…” to open existing record files (Including offline record created by meter itself).
Click “Export…” to export the current opened record as CSV file to process the data with other application.
2.0.5 Online record typical procedure
- Click“Create New”.
- Adjust
Sample Rate,Auto Start/StopParameters to proper values, check items you want to record. - Click green start button.
- After manual/auto stop, analysis/save/export the record.
2.0.6 Graph Area
Click and hold some point on the graph, to view detailed value at that point.
Right click and drag to move the graph horizontally.
Use the wheel to zoom in/out.
2.1 VBUS Ripple
View AC-coupled voltage on VBUS:
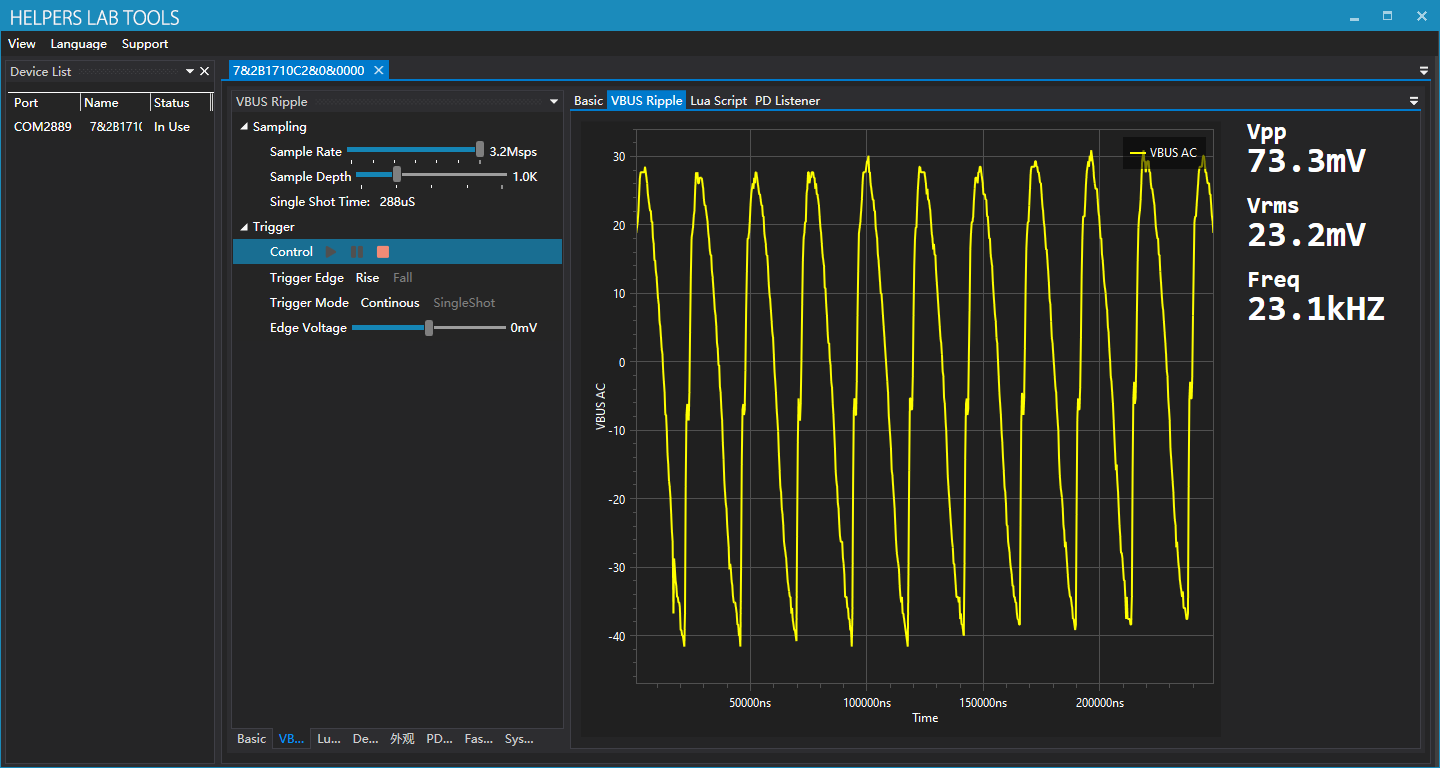
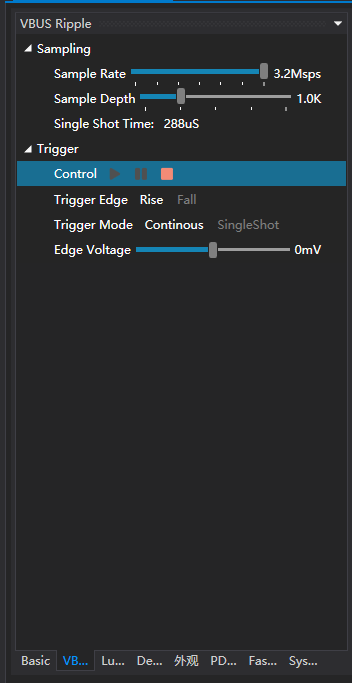
2.1.1 Sample Rate
Drag to adjust the sample rate, range 0.1-3.2Msps.
2.1.2 Sample Depth
Drag to adjust the sample depth (How many points are contained per sample).
2.1.3 Trigger Edge
Click to select the trigger edge.
2.1.4 Trigger Mode
Click to select the trigger mode.
2.1.5 Edge Voltage
Drag to specify the edge voltage.
2.1.6 Graph Area
Graph area is on the right side of the screen.
Click and hold a point on the graph to see precise value on that point.
Right click and drag to move the graph horizontally.
Use the wheel to zoom in/out.
2.2 Lua Script
This article only describes lua related features on the software, for more information, please go here.
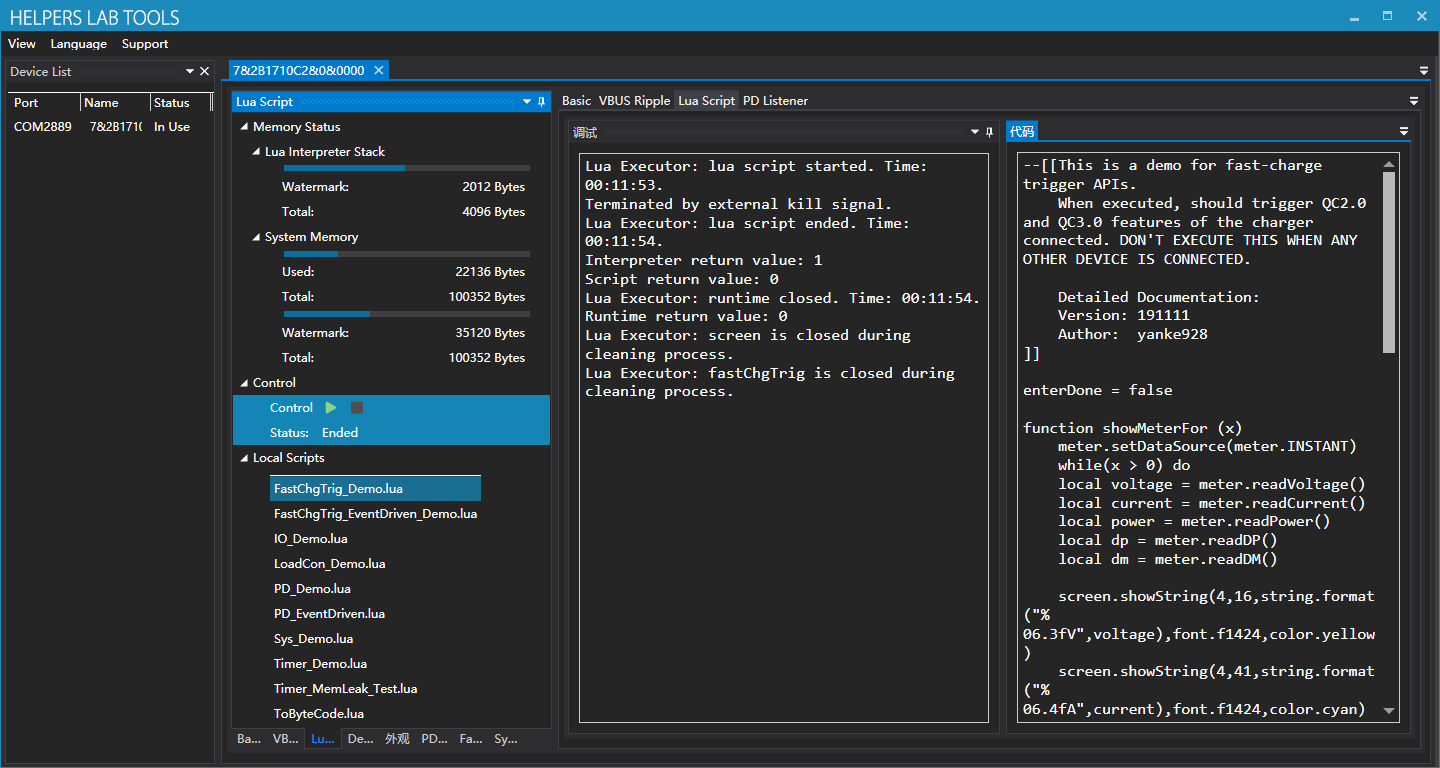
2.2.1 Memory Status
Real-time memory status is shown here.
2.2.2 Local Scripts
Here local scripts are listed, example codes are stored by default.
2.2.3 Debug
This is the output terminal. Outputs of Lua program, Lua executor, Lua Interpreter are all here.
2.2.4 Code
Currently loaded code, click green button to download and execute.
2.2 FastCharge Trigger
You can use fast-charge trigger feature on the PC software as well as the meter itself.
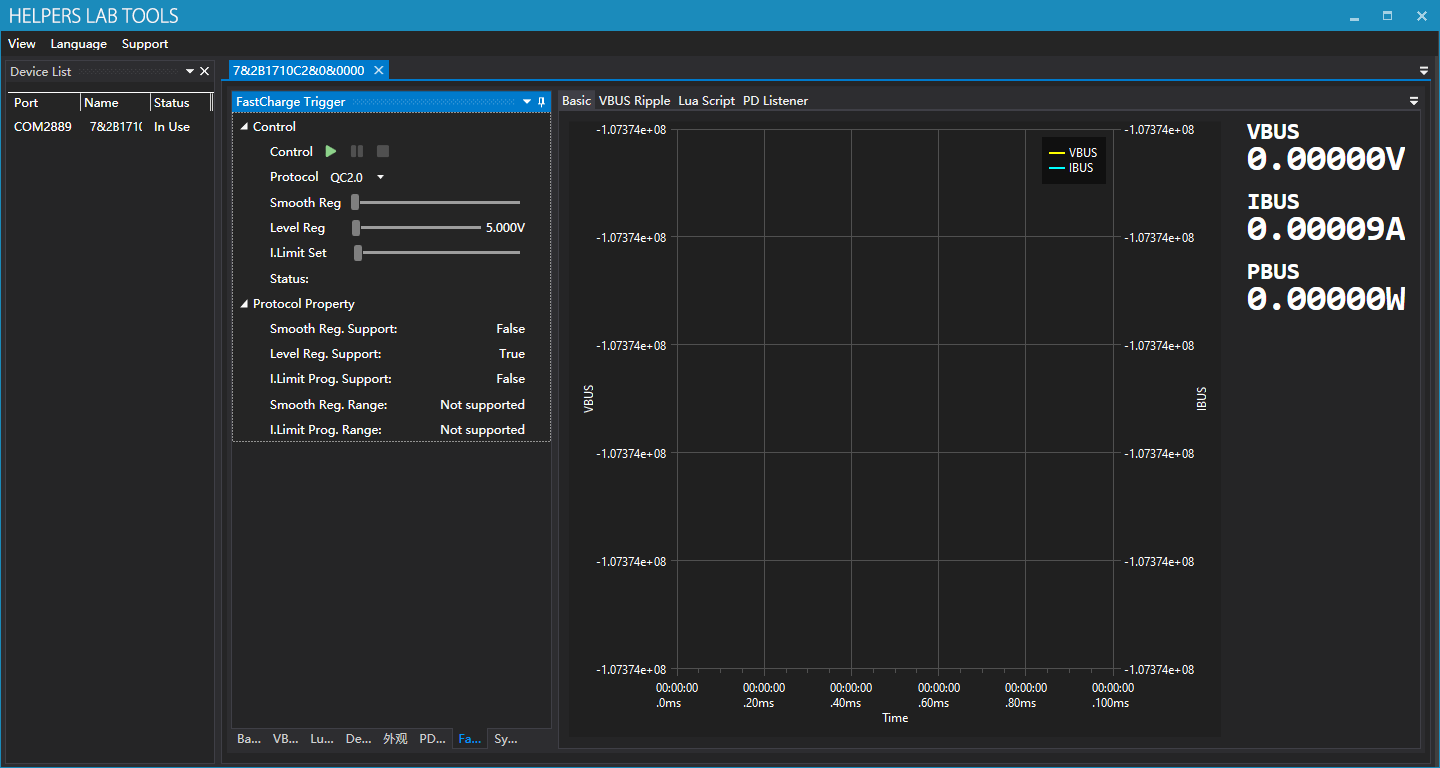
2.3.1 Select the protocol
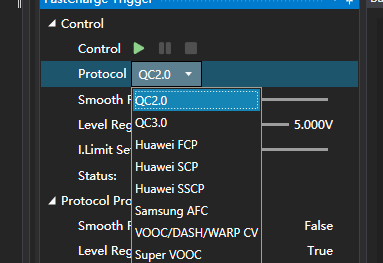
Select the protocol being triggered here.
2.3.2 Protocol Properties
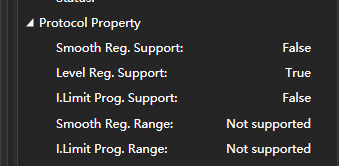
Here properties of the protocol you’ve selected are shown.
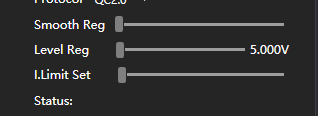
2.3.3 Adjustment
After click the green start button, you can make adjustments on voltage and current limit:
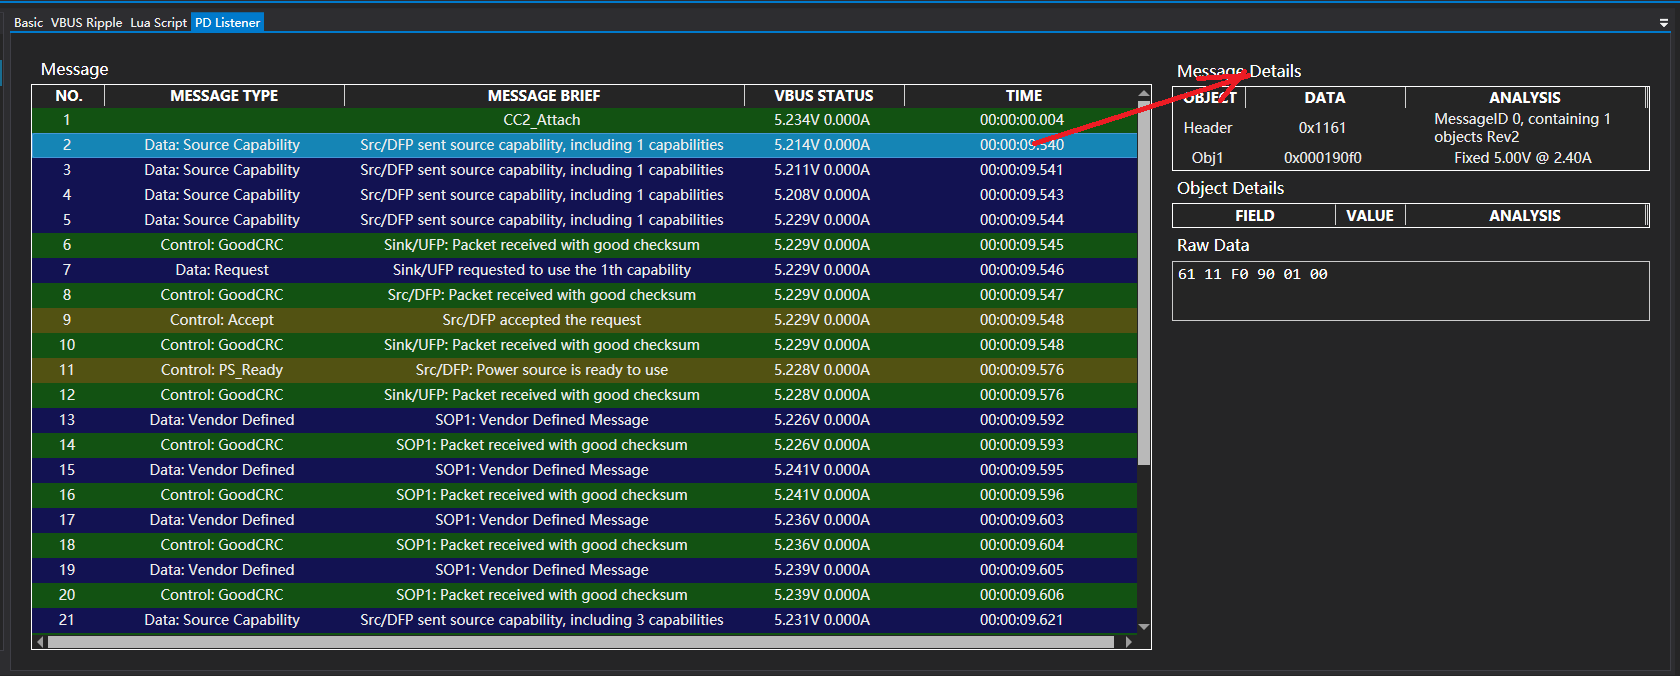
2.4 PD Listener
To use listener, please follow the following procedure strictly:
- Make sure PD communication switch is on the “ON” position.
- Connect the charger and the meter with a C-C cable.
- Click green start button.
- Use another C-C cable to connect the other Type-C port to your being tested device.
- If you expected some message to appear but it didn’t, you might need to flip one of the Type-C plug connected on the meter.
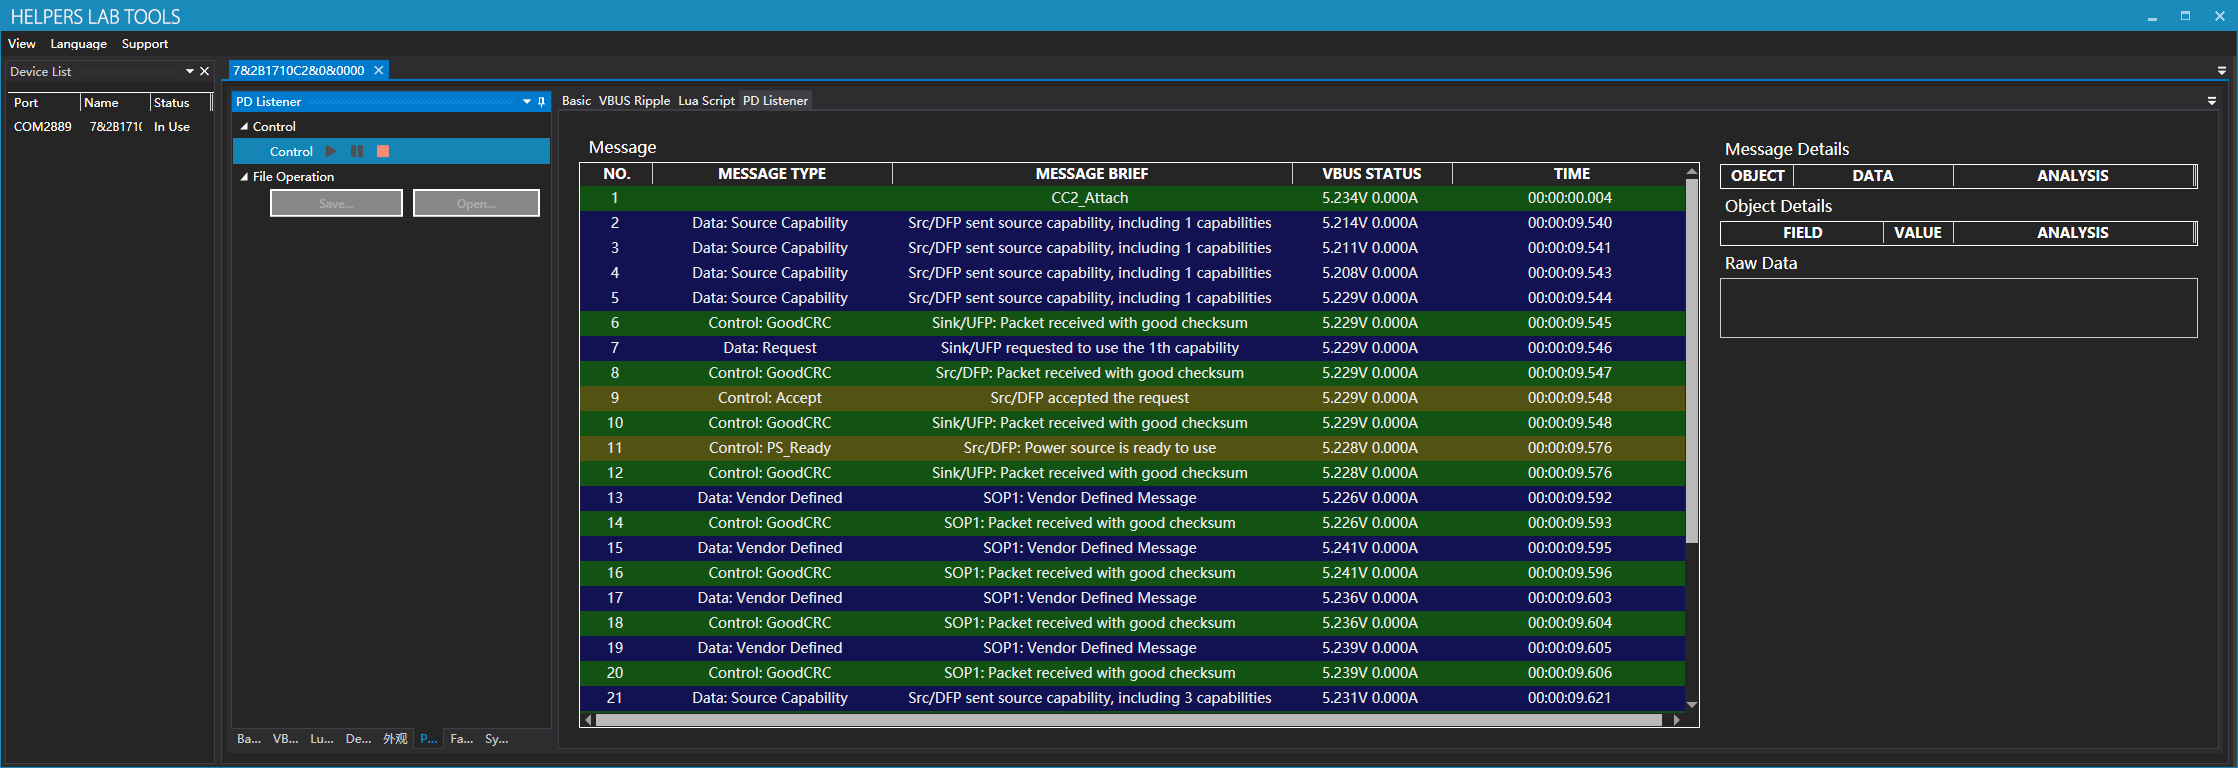
2.4.1 Message Details
Click a message and you’ll see message details on the right side:
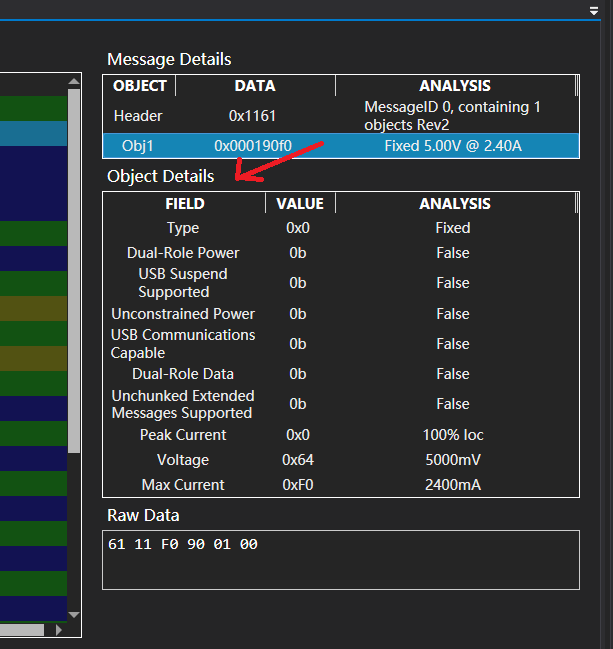
2.4.2 Object Details
Click a data object and you’ll see object details on the bottom:
2.4.2 File Operations
You can save and open PD listener stream:
2.5 Modules
The module panel contains the expansion modules accessible from the software.
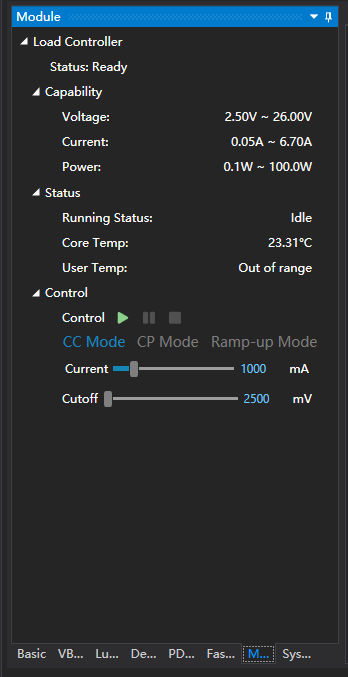
2.5.1 Load Controller
You can operate load modules mounted on the meter here.
Capabilities and the status of the module is shown above.
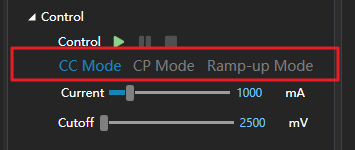
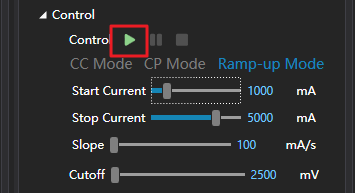
To start the load, you select the load mode here first. Modes:
CC Mode: Constant current mode, usually used for aging or capacity tests.
CP Mode: Constant power mode, usually used for aging or capacity tests.
Ramp-Up Mode: In this mode, the load is increased gradually, from Start Current , to Stop Current , with specified slope Slope . This is usually used to determine the maximum load capability of a power source. Apply this combined with graphing yields a V-I graph of the power source.
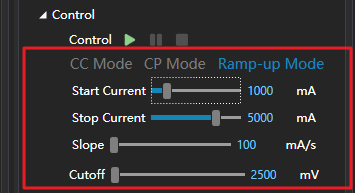
Then, you set the parameters for your mode (Different modes have different parameters). You can either drag the scrollbar or edit the value in the textbox directly.

Finally, you click the start button.
2.6 System
2.6.1 Firmware Update
Click “Update” to perform a firmware update, this process should take around 20 seconds.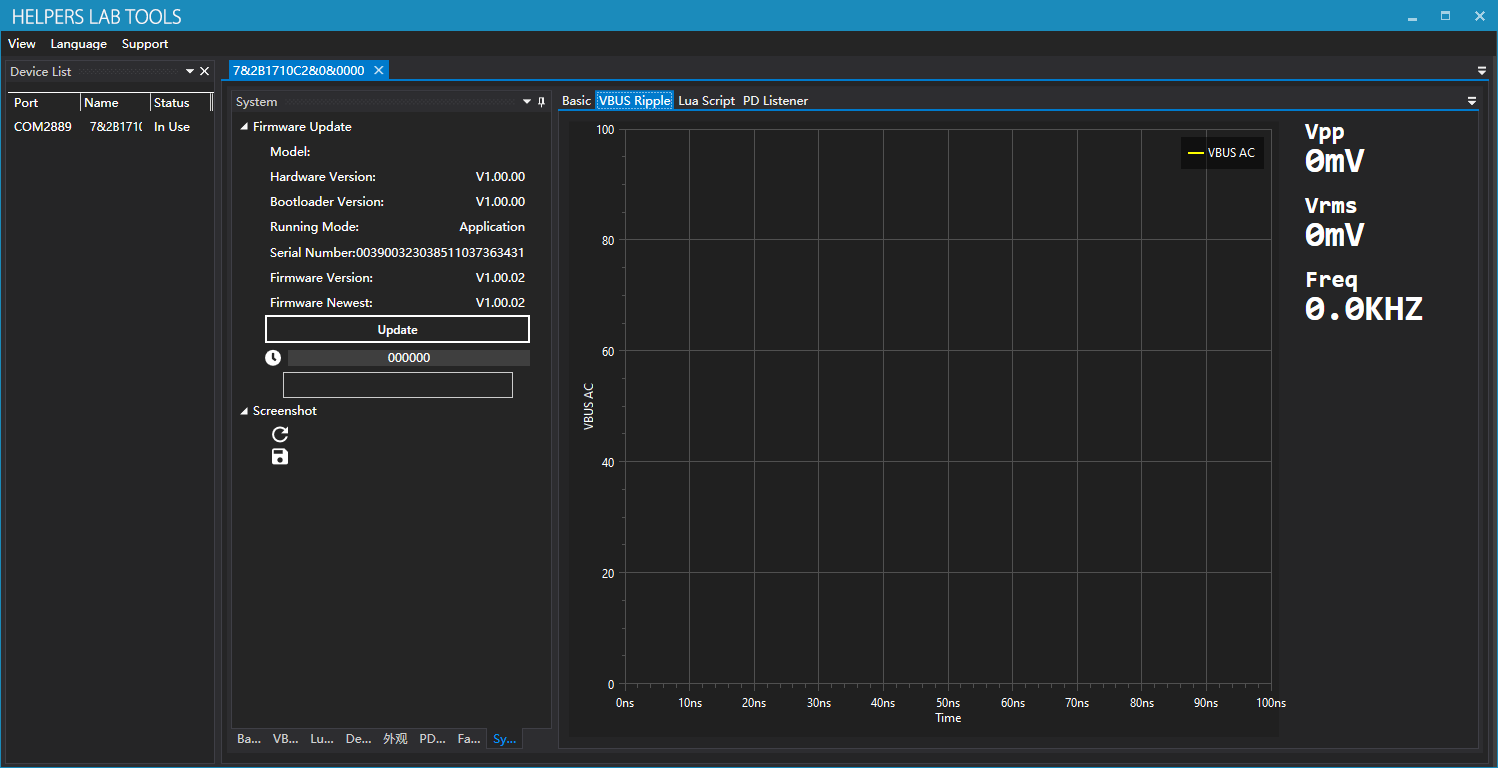
2.6.2 Screenshot
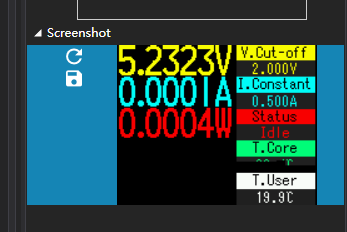
Click refresh button to capture new screenshot, click save button to save the screen shit.
Notice that some UI might not be able to be captured (Mostly graphing like VBUS oscilloscope, VBUS & IBUS graph), as they utilizes different graphic mode.

